



Office Space Sizes are one thing that most founders get wrong while building a sustainable business. Some anchor to what the last office looked like, others just take whatever a broker shows them that fits the budget. Both approaches tend to go wrong in the same two directions: paying for square meters that sit empty, or cramming a growing team into a space that quietly kills collaboration and makes every new hire’s first impression a bad one.
The fix isn’t complicated, but it does need real numbers rather than a gut feeling.
By starting with a layout that’s actually designed around how your team works. The math is how it shifts as you scale from 20 to 50 to 100 people, and where design decisions change the outcome more than the raw benchmark does.
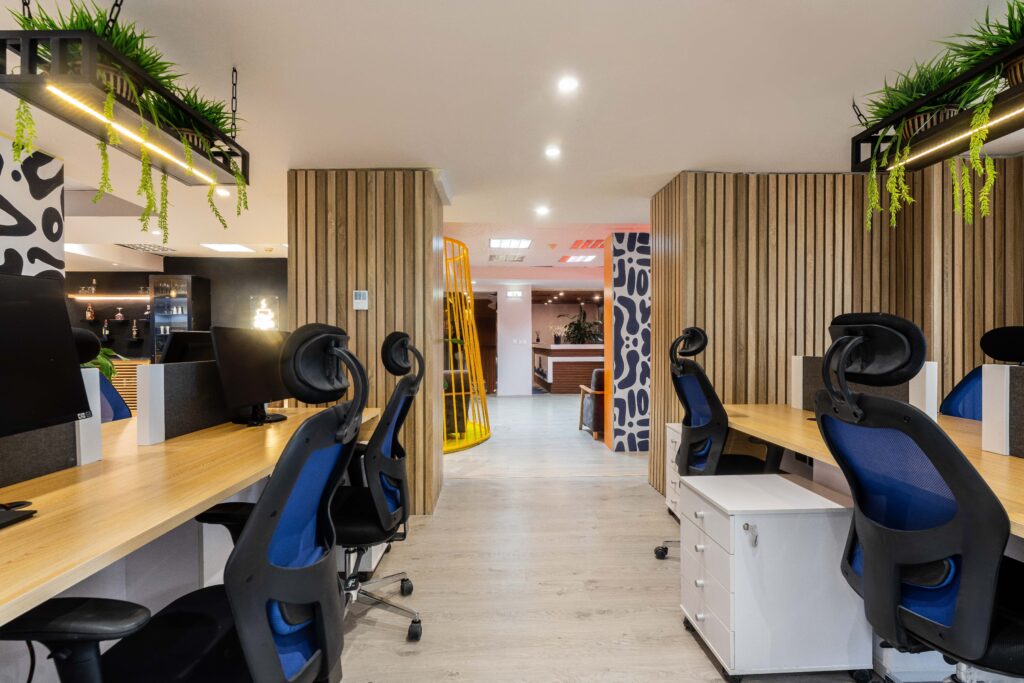
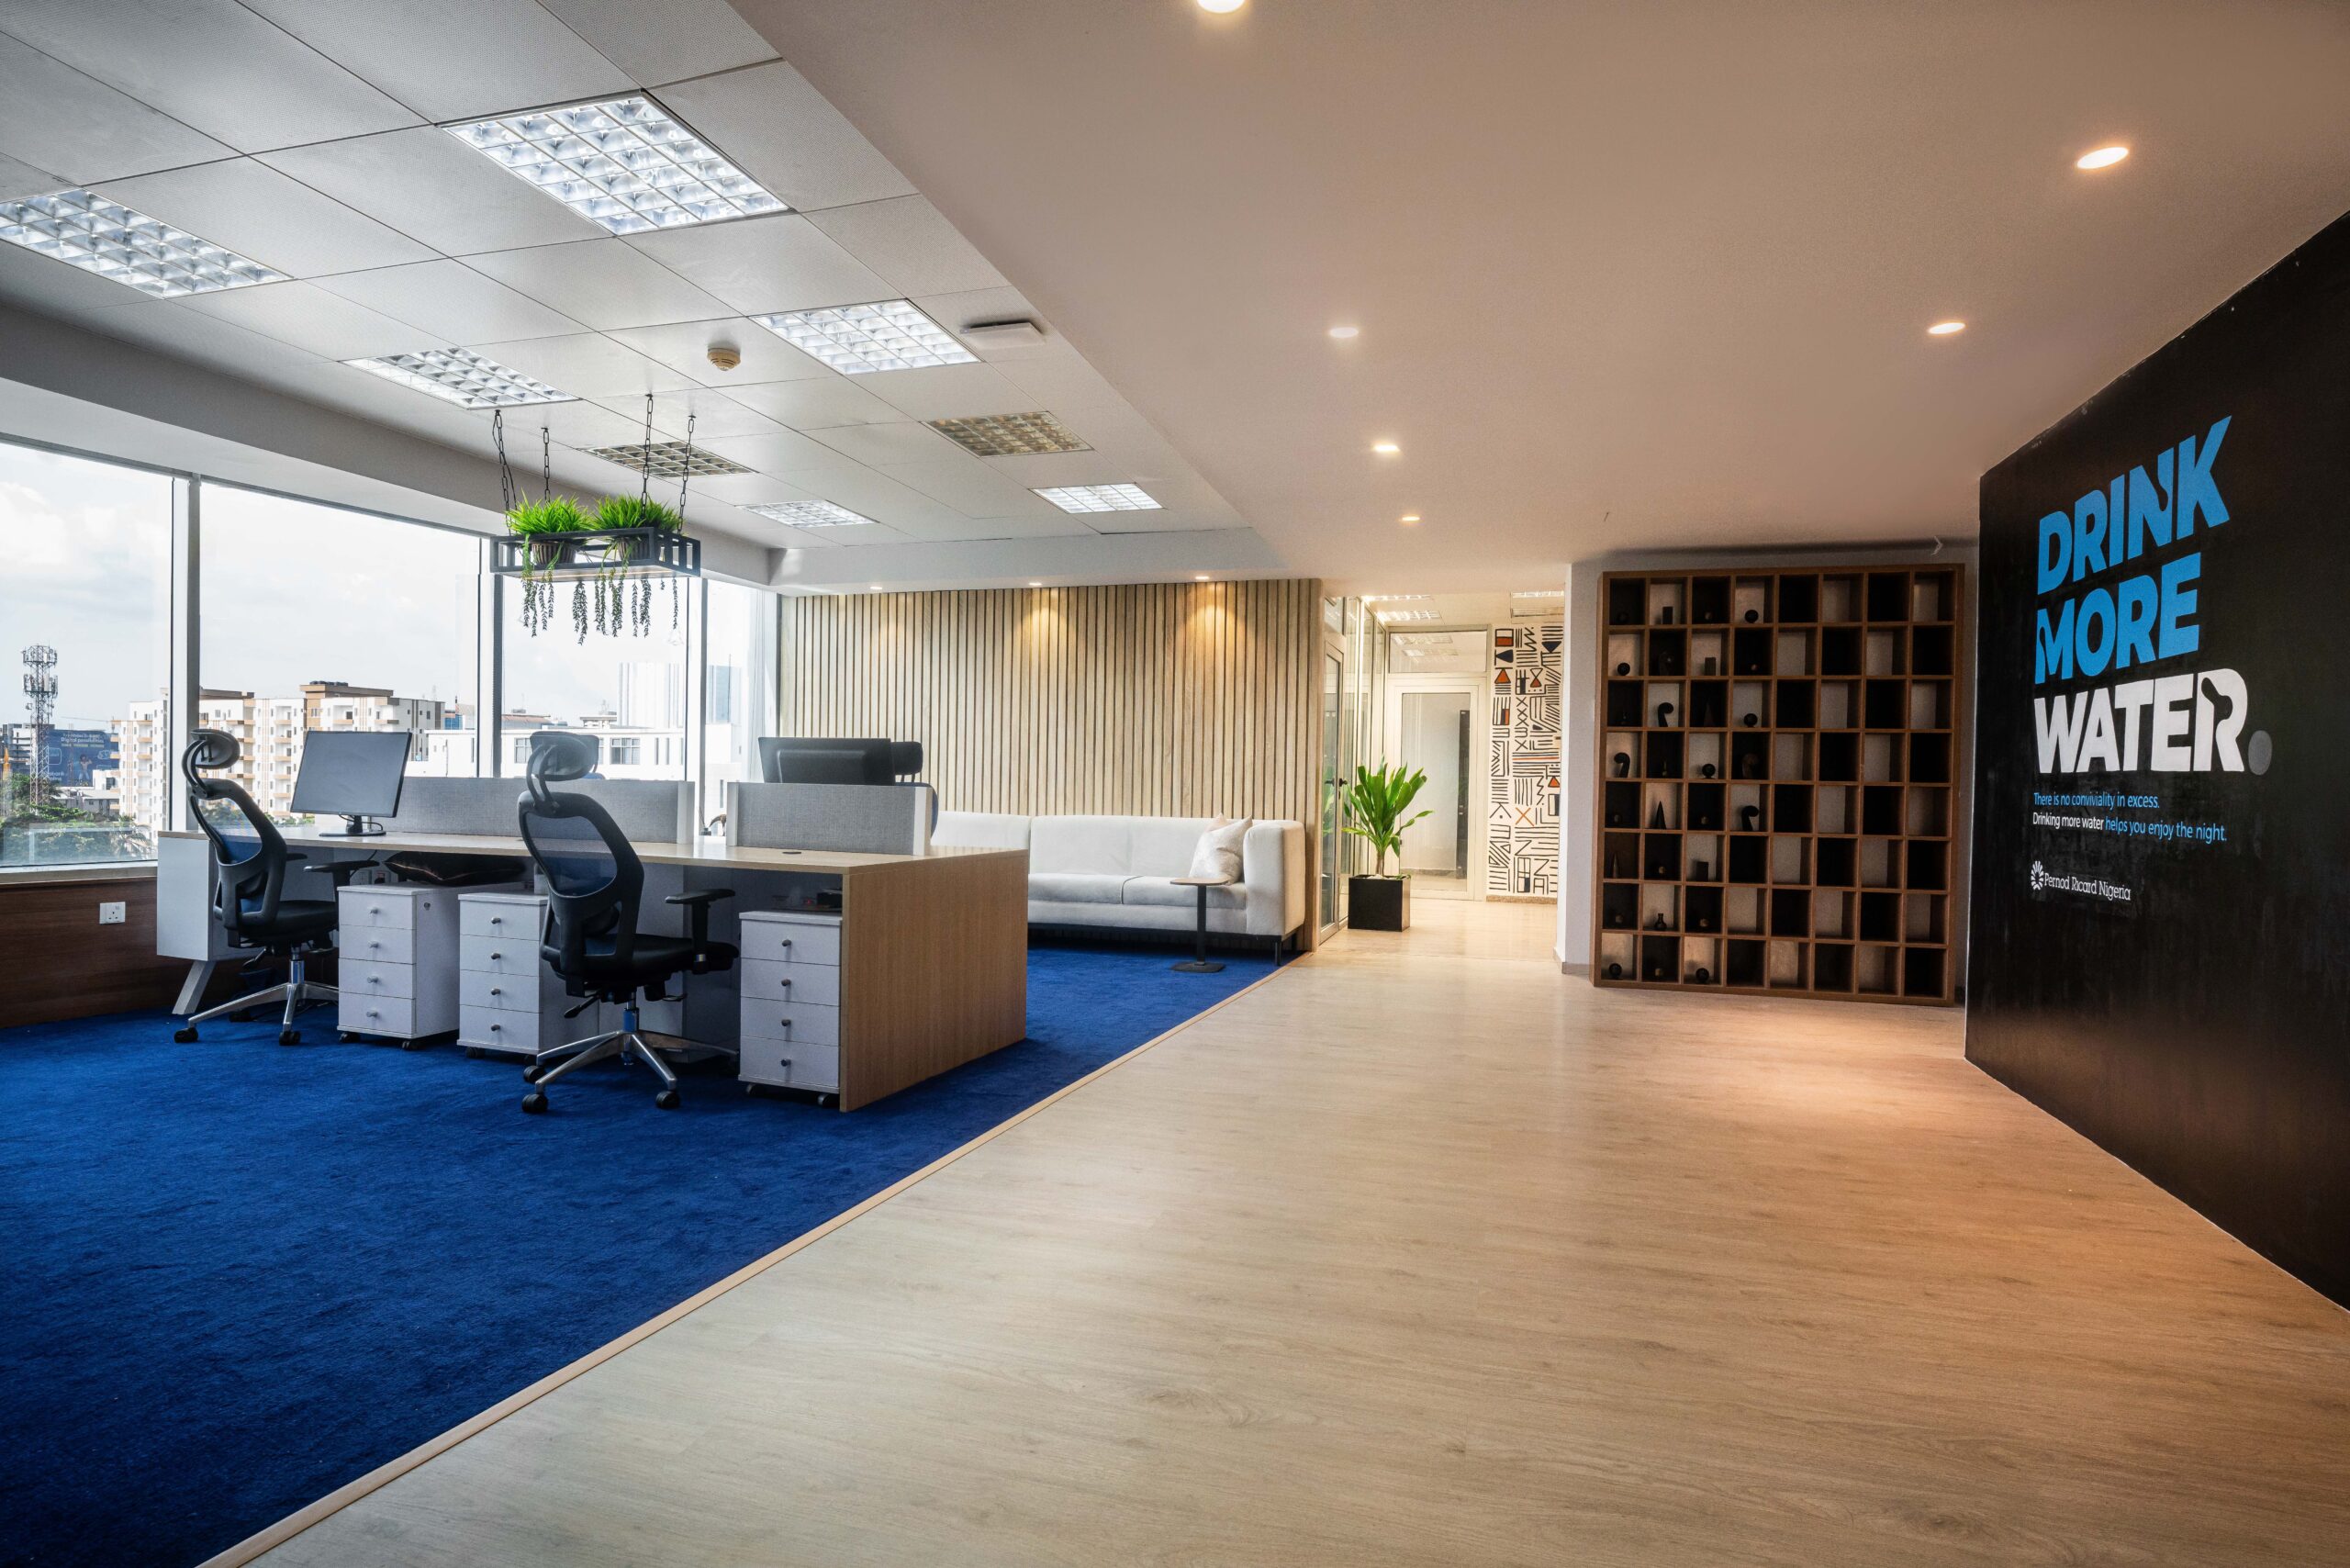
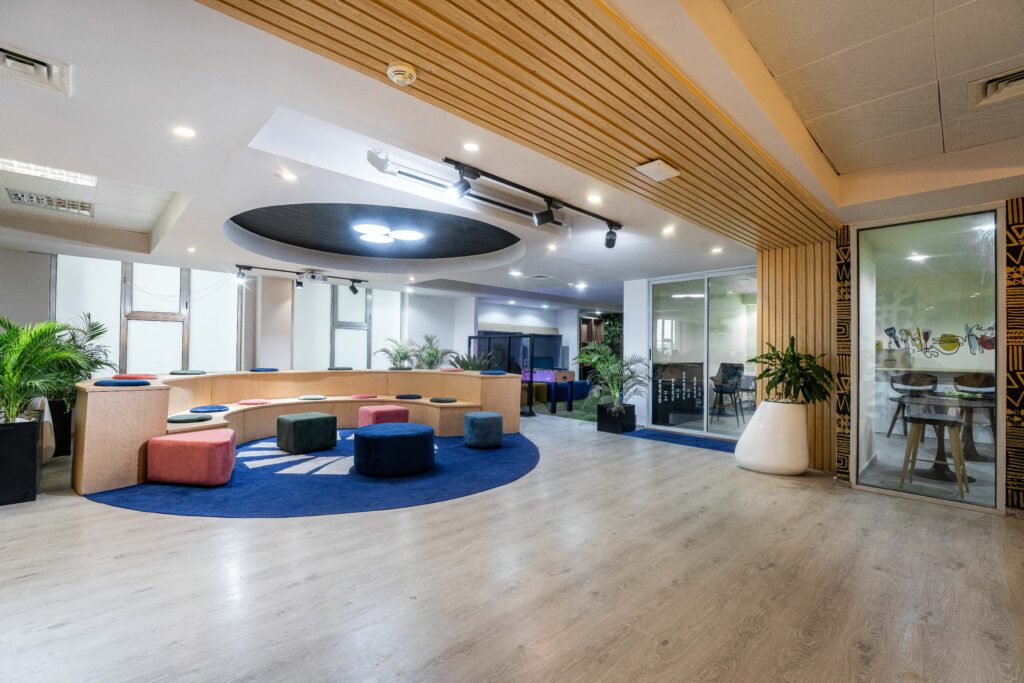
Pernod Office Space designed by Teal Harmony
The baseline Office space per person
Commercial real estate globally uses a rough benchmark of 6–9 square meters per employee figures commonly cited by workplace strategy bodies like BOMA and IFMA; depending on how dense or open the layout is.
Tighter, desk-heavy layouts sit at the lower end; anything with generous breakout areas, meeting rooms, and circulation space pushes toward the higher end. Treat this as a starting range to sanity-check a broker’s number against, not a fixed rule.
Your actual figure depends on layout choices covered below.
| Headcount | Conservative (m² / person) | Comfortable (m² / person) | Rough total range |
| 20 employees | 6 m² | 9 m² | 120 – 180 m² |
| 50 employees | 6 m² | 9 m² | 300 – 450 m² |
| 100 employees | 6 m² | 9 m² | 600 – 900 m² |
These ranges assume a traditional full-occupancy layout. They almost never hold once hybrid work enters the picture, which for most Lagos teams today, it does.
Why hybrid work changes the math
If your team is in the office five days a week, the table above is your answer. But if attendance is closer to 60–80% on a typical day, common across Lagos teams balancing commute time and traffic against in-office collaboration. You are likely over-provisioning by planning for 100% attendance that rarely happens.
A more realistic approach: calculate desks for your average daily attendance, not your total headcount, then add a buffer of 15–20% for peak days (all-hands, client visits, in-person weeks). A 50-person team with 70% average attendance needs roughly 35 working desks day-to-day 40 to 42 once the peak-day buffer is added and not 50. That’s the difference between leasing 300 m² and closer to 240 m² at the conservative benchmark, which can mean one size category smaller and a meaningfully different lease cost.
What design changes that a benchmark alone can’t
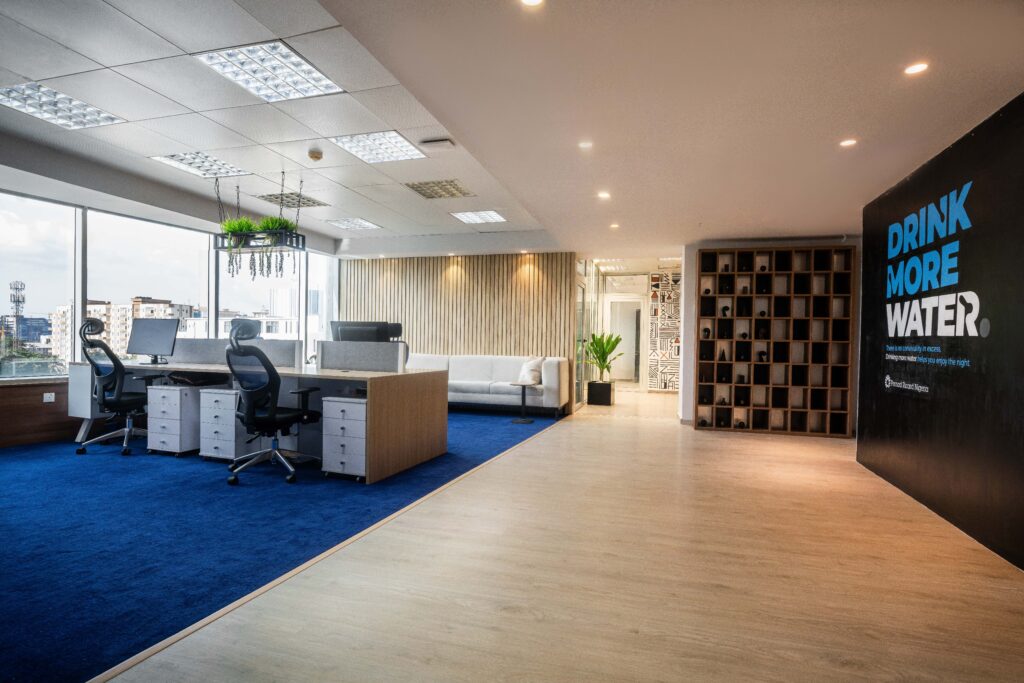
The 6–9 m² range assumes a layout, and layout is a design decision, not a fixed input. This is where the numbers above stop being the whole story:
- Open-plan desking with shared, bookable focus rooms typically needs less area per person than a grid of assigned desks and enclosed offices, because circulation and meeting space are shared rather than duplicated.
- Hybrid-attendance offices only realize their space savings if the layout supports hot-desking well , lockers, desk-booking signage, and power/data at every seat , otherwise a smaller footprint just creates a scramble for desks on busy days.
- Acoustic and zoning choices (quiet zones vs. collaboration zones) can let you run tighter on raw m² per person without the density feeling cramped, because the layout is doing the work the square footage alone isn’t.
- A well-planned smaller office can outperform a larger, poorly zoned one on both cost and how it feels to work in , which is the gap between a real estate calculation and a design one.
In practice, this is the conversation worth having before signing a lease: what the attendance-adjusted desk count is, and what layout gets you there without the space feeling either empty or crowded. We’ve walked Lagos-based teams through exactly this trade-off when their headcount outgrew their original office plan.
What actually changes at each stage
 20 employees: Space decisions here are still cheap to get wrong, but that also means it’s the easiest point to lock in bad habits , usually over-leasing ‘for growth’ that doesn’t arrive on schedule. Favor flexible or shorter-term space, and a layout that can be reconfigured, over a five-year commitment at this stage.
50 employees: This is where headcount usually outpaces the original office plan, and where the buy-vs-lease-vs-flex decision starts to matter financially. It’s also the stage where hybrid attendance patterns are established enough to actually measure, rather than guess , and where a re-layout often solves what looks like a size problem.
100 employees: At this scale, the cost of getting it wrong stops being a line item and starts being a strategic issue , multi-floor or multi-location tradeoffs, whether to consolidate into one HQ, and whether the office is still pulling its weight for hiring and retention rather than just holding desks. Layout and zoning decisions here affect culture and retention as much as they affect the lease line.
A simple way to apply this
- Pull your actual badge-in or attendance data for the last 3 months , not what policy says, what people actually do.
- Calculate average daily attendance as a percentage of headcount, not total headcount.
- Multiply average attendance by 6–9 m² depending on desired density, then add a 15–20% buffer for peak days.
- Sanity-check the resulting number against your intended layout , open-plan and hot-desking can bring it down further; assigned desks and enclosed offices push it back up.
- Re-run the calculation before every renewal, attendance patterns shift faster than most leases do.
Try it with your own numbers
Office space sized for total headcount rather than actual attendance is a common , and expensive , way founders overpay, and it’s compounded when the layout isn’t designed around how the space is actually used. The right number isn’t a benchmark you copy from an article , it’s your own attendance data, run through a simple formula, and matched to a layout built for your team. Get that right once, and every space decision after it gets easier.
We’re offering a interior consultation to help you bring your dream office space to life.